
Analytics and Performance Tracking: The Insider’s Guide to Data-Driven Fundraising
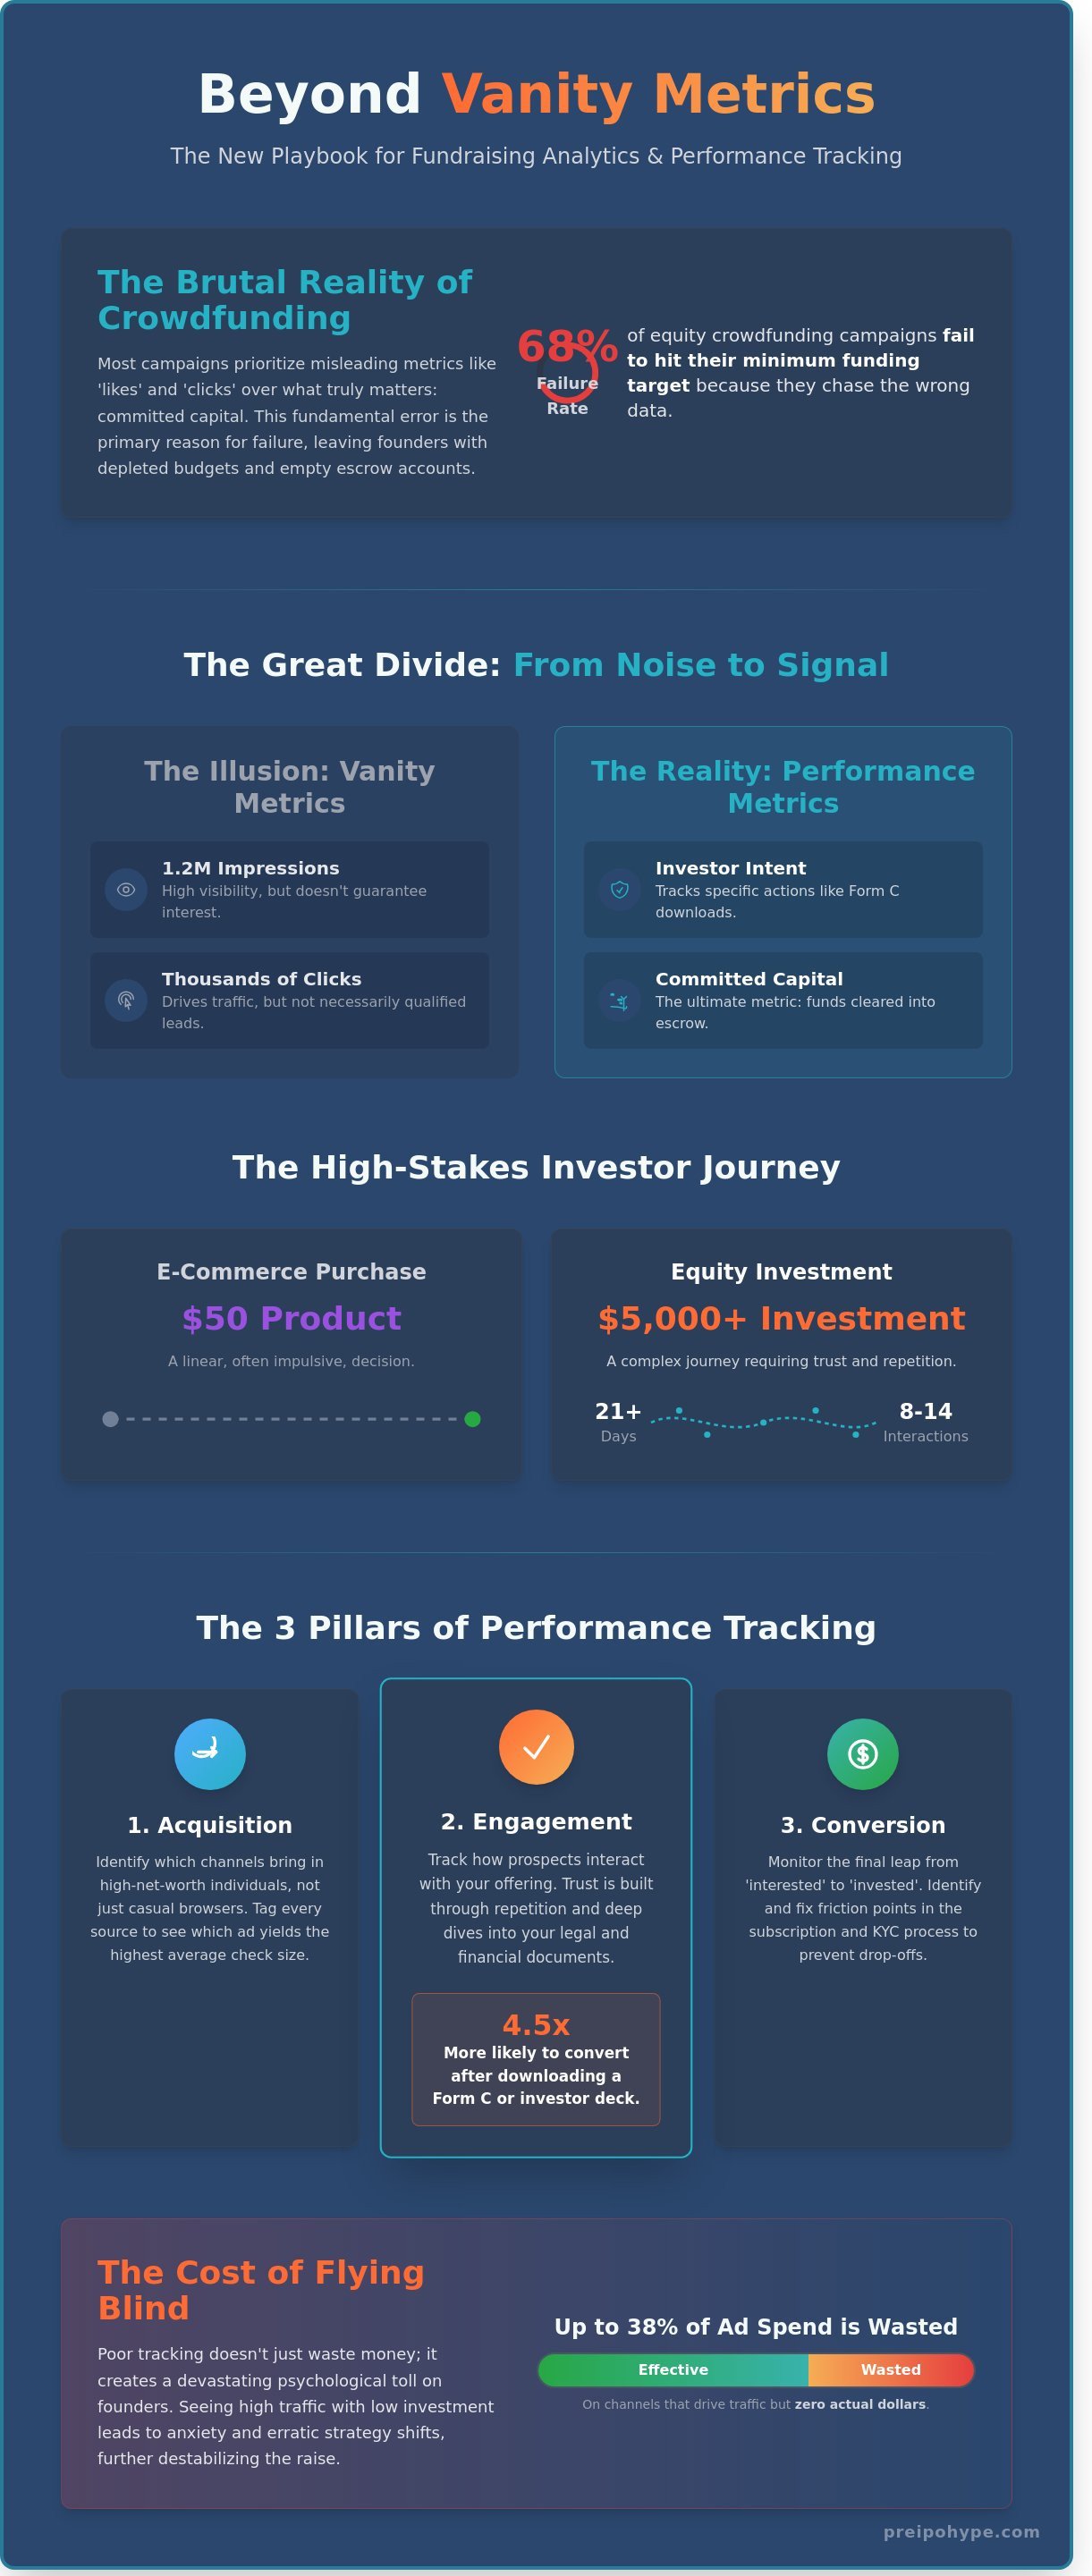
Your social media engagement is a liability if it doesn't convert into committed capital. Data from 2023 indicates that 68% of equity crowdfunding campaigns fail to hit their minimum funding targets because they prioritize vanity metrics over real investment velocity. It's a brutal reality; without precise analytics and performance tracking, you're flying a multimillion dollar raise through heavy fog. You've likely felt the sting of a $5,000 ad spend that generates thousands of clicks but zero dollars in the escrow account, leaving you unable to prove which channel actually drove the result.
We agree that your marketing spend should function as a predictable engine for growth, not a gamble. This guide will teach you to master the institutional metrics that transform digital curiosity into signed subscription agreements for your Reg CF or Reg A+ raise. You'll gain the ability to justify every cent to your board while securing a 3x higher ROI on your investor acquisition campaigns. We're pulling back the curtain on the dashboard strategies that separate the market leaders from the noise.
Key Takeaways
- Move beyond vanity metrics to identify the specific data points that transform digital curiosity into committed capital for your raise.
- Build a rock-solid technical foundation using advanced analytics and performance tracking to seamlessly integrate your marketing stack with your investor CRM.
- Solve the mystery of the 60-day investor journey by mastering attribution models that account for high-stakes financial decision-making.
- Transform weekly performance reports into actionable insights that help you optimize your story framework and make data-driven "pivot or persevere" decisions.
- Leverage institutional-grade infrastructure to bridge the gap between retail momentum and the sophisticated reporting required for a successful exit.
Beyond Vanity Metrics: Why Fundraising Analytics Requires a Different Playbook
Fundraising analytics is the technical bridge where digital marketing data intersects with your investor CRM. Most Detroit founders fail because they mistake noise for signal. They celebrate high traffic numbers while their escrow accounts remain stagnant. In the high-stakes environment of a capital raise, your analytics and performance tracking must move beyond surface-level observations to identify the precise moment an observer transforms into a shareholder.
Vanity metrics are the silent killers of a Reg CF or Reg A+ campaign. You might see 1.2 million impressions on a targeted LinkedIn ad, but that rarely translates to $1.2 million in funding. In fact, 2023 SEC filing data suggests that conversion rates for equity crowdfunding often hover between 1% and 3% for cold traffic. If you aren't tracking the specific path from the first click to the final signature, you're merely guessing with your marketing budget.
To better understand the mechanics of data reporting, watch this helpful video from the Google Analytics team:
Standard Web Analytics models built for e-commerce platforms like Shopify fall apart in the private markets. Selling a $50 consumer product is a linear, impulsive process. Securing a $5,000 investment is a multi-touch journey that requires an average of 8 to 14 digital interactions over a 21 day period. You need a hierarchy of data that tracks the evolution of a lead: from initial awareness to measurable intent, through to legal commitment and finally, the clearing of funds into escrow.
The 3 Pillars of Performance Tracking
- Acquisition: Identify which specific channels bring in high-net-worth individuals rather than just "looky-loos." This involves tagging every source to see which ad creative yielded the highest average check size.
- Engagement: Track how many times a prospect returns to your offering page. Trust is built through repetition; data shows that investors who download a Form C or an investor deck are 4.5 times more likely to convert.
- Conversion: This is the final leap from the "interested" phase to being a line item on your cap table. You must monitor the drop-off points within the investment funnel to ensure your analytics and performance tracking catches friction in the KYC (Know Your Customer) process.
The Cost of Flying Blind
Poor tracking results in founders burning capital on the wrong marketing channels. A 2023 internal audit of several failed Reg CF raises showed that startups often waste up to 38% of their ad spend on platforms that drive traffic but zero actual dollars. This inefficiency creates a devastating psychological toll. When a founder sees 50,000 visitors but only 5 investments, the resulting anxiety leads to erratic strategy shifts that further destabilize the raise.
Investor intent is the aggregate of specific digital actions, such as multiple visits to the subscription page or downloading a Form C, that statistically predict a high probability of capital commitment.
The Foundation: Technical Performance Tracking for Reg CF and Reg A+ Raises
Detroit founders often mistake a compelling pitch deck for a guaranteed funded round. It isn't. In the high-stakes environment of equity crowdfunding, the difference between a stalled campaign and a viral success lies in your analytics and performance tracking. You're not just selling a product; you're selling a future. That requires a technical infrastructure that captures every digital breadcrumb dropped by potential investors. Without a rigorous foundation, you're essentially burning capital on guesswork.
Pixel Perfection: More Than Just Code
Standard tracking pixels are no longer sufficient for serious capital raises. Since the 2021 iOS 14.5 update, approximately 96% of users have opted out of app tracking, creating a massive data gap for digital marketers. To maintain visibility, you must implement server-side tracking via Conversational API (CAPI). This bypasses browser-level blocks and ensures your Meta and Google ads receive accurate conversion data. For a Detroit-based raise, LinkedIn pixels are equally vital. They allow you to retarget high-net-worth individuals who have engaged with your professional content but haven't yet committed to the round.
- Server-Side Tracking: Essential for capturing the 40% of data typically lost to ad blockers and privacy updates.
- Cross-Platform Attribution: Identifying if an investor first saw you on LinkedIn but finally committed via a Google Search.
- Offline Integration: Manually syncing leads from local Detroit networking events into your digital dashboard to ensure a 360-degree view.
Even sectors focused on social impact recognize the necessity of rigorous data. The principles of Nonprofit Performance Measurement from the Harvard Kennedy School highlight that without clear metrics, effective management is impossible. In the context of a Reg A+ raise, this lack of clarity can lead to a 15% to 25% waste in your total advertising budget. Precision isn't just a technical requirement; it's a fiduciary one.
The Custom Investor CRM Advantage
A standard sales CRM isn't built for the complexities of equity crowdfunding. You need a system that tracks SEC compliance, accreditation status, and specific investment intent. This is where lead scoring becomes your secret weapon. By assigning point values to actions-such as downloading an offering circular or spending more than three minutes on your "Use of Funds" page-you can identify your "Whales" before they even make a move. A prospect with a lead score over 85 warrants a direct, personal outreach from the CEO.
Automating the follow-up process based on this engagement data ensures that high-intent prospects don't go cold. If a lead views your webinar but doesn't click "Invest," your CRM should trigger a specific email sequence addressing common objections within 24 hours. This level of analytics and performance tracking transforms your marketing from a broad net into a precision instrument. It allows you to focus your energy on the 20% of leads that will likely provide 80% of your capital. If you're serious about scaling your investor relations, you must treat your data with the same respect as your cap table.
Real-time campaign optimization is the final piece of the puzzle. Custom dashboards should aggregate data from your CRM and ad platforms to show your real-time Cost Per Acquisition (CPA). If your CPA on Meta spikes by 30% on a Tuesday morning, you need the visibility to pivot by Tuesday afternoon. This agility is what separates the ground-floor opportunities from the companies that never leave the basement.
Attribution Alchemy: Solving the 60-Day Investor Journey Mystery
"My ads are running, but nobody is investing today." This is the most common frustration Detroit founders voice when they launch a Reg CF or Reg A+ campaign. You watch the dashboard, waiting for the ticker to move, but the numbers stay flat. You feel the urge to kill the creative or pivot your strategy. Stop. You're looking at the wrong clock. You're judging a marathon by the first hundred meters.
Investing in a private offering isn't a twenty dollar impulse purchase on a retail site. It's a calculated commitment to a company's future. Data from mid-market raises shows that the average investor journey lasts 60 days from the first click to the final signature. This isn't a failure of your marketing; it's the reality of high-stakes financial psychology. Professional analytics and performance tracking must account for this lag, or you'll end up making decisions based on incomplete data.
The "Last Click" fallacy is the quickest way to ruin a perfectly good raise. If you rely on standard reporting, your email list will look like a hero while your social media looks like a zero. This is a dangerous lie. Your social ads did the heavy lifting of building awareness and momentum weeks ago. The email was just the final nudge that pushed them over the edge. To scale effectively, you need a robust data-driven fundraising framework that accounts for every touchpoint. Without it, you'll likely cut the very channels that are actually feeding your funnel.
The Anatomy of an Investor's Decision
Marketing psychology relies on the "Rule of 7." An investor needs at least seven exposures to your brand before they trust you with their capital. We track this through the Pre-IPO Hype Video Funnel to see exactly where they engage. Are they watching 15% of your pitch or 95%? If 82% of your audience drops off in the first 10 seconds, your problem isn't the platform; it's your hook. By the time they hit the 60-day mark, they should have seen your founder's story, your valuation benchmarks, and your roadmap multiple times.
Multi-Touch Attribution Models
Choosing an attribution model is about choosing the lens through which you view your capital raise. You can't rely on guesswork when six-figure checks are on the line. Consider these three frameworks:
- Linear Models: These give equal credit to every touchpoint. It's democratic but often misses the nuance of what actually drove the "hype."
- Time-Decay Models: These give more credit to the interactions that happen closest to the investment. This is useful for high-velocity raises.
- Position-Based Models: This is our preferred method. It gives 40% credit to the first touch and 40% to the last, spliting the remaining 20% among the middle interactions.
For a Detroit raise, you need to know what sparked the initial interest and what finally closed the deal. Advanced analytics and performance tracking allow you to see that a LinkedIn ad in week one was just as vital as the webinar in week seven. Attribution isn't about finding the "winning" ad; it's about understanding the investor's path to trust. When you understand the path, you can pave it with more certainty and less wasted capital.
Data-Driven Optimization: Turning Performance Insights into Capital
Capital isn't won by accident or through sheer charisma. It's engineered through relentless analytics and performance tracking. Your weekly reports shouldn't be treated as static documents; they're the pulse of your Detroit capital raise. When you look at the numbers every Monday, you're making a "Pivot or Persevere" decision. If your cost per lead for a Series A tech round in the Midwest stays above $55 for two consecutive weeks, the market is telling you the current angle isn't biting. You don't wait for the monthly board meeting to adjust. You kill the underperforming assets immediately.
A/B testing your story framework is how you separate genuine momentum from expensive noise. We've seen founders test a "Safety and Yield" angle against a "High-Growth Disruption" narrative. In one 2023 case study, the disruption angle generated 3x more clicks, but the safety angle produced 5x more actual investment capital. The data proves which "hype" angle is actually converting. You must identify where the friction lives in your funnel. Is it the ad, the landing page, or the offering circular? Use these indicators to diagnose the problem:
- High CTR, Low Page Conversion: Your ad's promise doesn't match the landing page reality.
- High Page Conversion, Low Circular Downloads: Your value proposition is strong, but the financial terms are causing hesitation.
- High Downloads, Zero Checks: Your offering circular is either too complex or fails to create a sense of urgency.
Scaling the winners is the final step in the optimization cycle. Once your analytics and performance tracking shows a consistent Return on Ad Spend (ROAS) of 4:1 or higher, it's time to increase the pressure. You don't just dump $50,000 into the account overnight. You scale safely by increasing daily budgets in 20% increments every 72 hours. This prevents the algorithm from breaking and ensures your Investor Acquisition Cost remains stable as you hunt for larger whales.
The 'Hype' to Capital Ratio
Calculating your Investor Acquisition Cost (IAC) against the Lifetime Value (LTV) of an investor is the only way to measure true efficiency. If it costs you $1,400 to bring in a $15,000 check, your raise is highly profitable. We benchmark these specific performance metrics against 230+ successful raises to ensure our clients aren't overpaying for attention. In the current 2024 climate, the top 10% of raises maintain an IAC below 12% of the total capital raised. If your numbers are drifting higher, you need an immediate intervention. Founders should Ask the CEO for a custom audit of their current performance metrics to identify hidden leaks in their capital funnel.
Reporting to the Board
Institutional investors and board members don't want to see a sea of spreadsheets. They want a narrative of inevitable growth backed by hard data. When you present your analytics, focus on the velocity of capital. Show them the "Fundraising War Room" dashboard where you track real-time visibility of the investor journey. Highlight the "Time to Close" metric. Currently, elite private raises see the window from first touch to signed subscription agreement shrink to just 11 days during the peak hype cycle. Presenting these KPIs as a clear trend line transforms you from a founder asking for money into a sophisticated operator managing a high-performance financial machine.
The Pre-IPO Hype Advantage: Analytics Built for the Next Generation of Exits
The Detroit capital market is no longer a game of local handshakes and quiet favors. It's a high-velocity environment where momentum is the only currency that truly matters. Our proprietary 'Foundation' infrastructure has emerged as the industry standard because it doesn't just record events; it engineers outcomes. We've built a system that recognizes the private market is the final frontier of significant wealth creation, and we treat your data with the same intensity as a late-stage growth firm preparing for a unicorn-sized exit.
Bridging the gap between retail hype and institutional-grade reporting is where most campaigns fail. Founders often find themselves stranded between two worlds: the raw energy of the crowd and the cold, hard metrics required by family offices. Our infrastructure solves this by translating social engagement and "ground floor" excitement into the rigorous analytics and performance tracking that sophisticated backers demand. We provide the transparency of a public company long before you ever ring the bell at the NYSE.
In a 2024 market defined by 15-second attention spans, your tracking must be relentless. Our 60-day attribution model captures every touchpoint, from the first LinkedIn impression to the final wire transfer. This depth of visibility ensures that no lead is left behind in the noise of the digital landscape. It allows us to see exactly when a potential investor moves from curiosity to conviction, giving your team the power to strike while the iron is hot. We don't just show you who clicked; we show you who is ready to commit.
Positioning your company as a data-driven leader is about more than just the current round. It's about setting the stage for secondary liquidity and future valuation benchmarks. When you walk into a boardroom with a quantified history of investor behavior, you aren't just asking for money; you're presenting a proven system for growth. This level of preparation signals to the market that you are an informed insider who understands the mechanics of a modern exit.
Exclusive Access to Elite Insights
Success in a Detroit raise isn't a guess. We've analyzed over $100 million in facilitated funding data to identify the exact behavioral triggers that convert a casual observer into a committed backer. Our internal CRM works in perfect synergy with our omnichannel outreach mastery, ensuring your message hits potential investors across four different platforms simultaneously. This isn't just marketing; it's a strategic siege. Book a strategy session to see how our analytics stack can power your raise and provide the insider edge you need.
Your Future, Quantified
It's time to move from hoping for funding to executing a data-backed raise. The long-term value of your investor database extends far beyond the current round; it is a permanent asset that fuels every future milestone your company reaches. By utilizing advanced analytics and performance tracking, you turn your cap table into a strategic weapon. Every data point we collect today is a building block for your eventual liquidity event. Analytics is the difference between a lucky raise and a repeatable system that guarantees your place in the elite investment circles of tomorrow.
Own the Narrative of Your Next $100M Raise
The difference between a stalled raise and a massive liquidity event is the precision of your data. You've seen how vanity metrics fail to capture the reality of the 60-day investor journey. By implementing institutional-grade analytics and performance tracking, you move beyond guesswork and into the realm of predictable capital growth. Our custom Investor CRM is designed for the unique demands of Reg CF and Reg A+ offerings, ensuring no lead is lost in the noise of the private market. We've used these exact systems to facilitate over $100 million in funding for our clients. This isn't just about spreadsheets; it's about mastering a proven 60-day attribution tracking model to secure your company's future. You're now equipped to turn performance insights into a competitive advantage that attracts serious, high-net-worth interest. The ground floor is getting crowded, and the fastest way to the top is through a data-driven strategy. Ready to see the data behind a $100M raise? Book your strategy session now.
Your next big exit starts with the right numbers. Let's build the momentum that takes you there.
Frequently Asked Questions
What are the most important KPIs for an equity crowdfunding campaign?
The three pillars of a successful raise are Cost Per Acquisition, Return on Ad Spend, and your lead-to-investor conversion rate. You should aim for a Return on Ad Spend of at least 3.0x to ensure your marketing budget doesn't cannibalize your capital. Tracking these metrics daily allows you to identify which ground floor opportunities are resonating with your audience and which channels are wasting your budget.
How do I track investors who see an ad on mobile but invest on a desktop later?
You must implement cross-device tracking through server-side tagging and platforms like Meta's Conversions API. Data shows that 65% of investors discover deals on mobile, yet 72% of actual transactions are completed on desktop computers for security reasons. By using deterministic matching, you can link these sessions together. This ensures your attribution remains accurate and you don't accidentally kill high-performing mobile ads that are driving desktop conversions.
Is Google Analytics enough for tracking a Reg CF raise?
Google Analytics 4 is a powerful foundation, but it isn't a complete solution for high-stakes analytics and performance tracking in a Reg CF environment. Standard GA4 setups often miss up to 30% of conversion data due to iOS 14.5 privacy restrictions and ad blockers. You need a dedicated dashboard that integrates your escrow platform data with your CRM to get a clear, 100% accurate picture of your capital inflow.
What is a 'good' conversion rate for an investor acquisition landing page?
A healthy conversion rate for an investor lead-capture page sits between 5% and 8%. If your page is optimized for unicorn hunter personas, you might see rates climb as high as 12% during peak momentum phases. Anything below 3% indicates a disconnect between your ad creative and your value proposition. You'll need to rapidly A/B test your headlines to fix this leak before your burn rate exceeds your funding.
How much should I spend on analytics and performance tracking software?
Budget approximately 5% to 10% of your total marketing spend on your analytics and performance tracking stack. For a $1 million Detroit capital raise, investing $7,500 in robust tracking tools is a calculated move that prevents a potential 20% loss in inefficient ad spend. High-quality data is the difference between a failed launch and an oversubscribed round. It's the price of admission for elite investment circles.
Can I track which specific email led to an investment in my CRM?
Yes, you can track this by appending unique UTM parameters to every link and using hidden fields in your investment forms. Email marketing typically drives 40% of total capital in successful raises, so knowing which insider update triggered a check is vital. When an investor clicks a link, your CRM should automatically tag their profile with the specific campaign ID. This level of granularity lets you double down on the messaging that works.
How do I measure 'hype' or momentum in a way that my board will understand?
Quantify hype using a Velocity Index that tracks the rate of change in social mentions, email signups, and daily dollar commitments. A 15% day-over-day increase in these metrics is a leading indicator of an upcoming liquidity event or funding surge. Presenting a heat map of investor activity provides the board with a visual representation of market heat. It turns abstract excitement into a concrete, data-driven financial indicator they can bank on.
What happens if my data shows my campaign is underperforming mid-raise?
You must pivot your strategy immediately if your Return on Ad Spend falls below 1.5x for more than four consecutive days. This usually happens during the trough of sorrow, a period in week three where 40% of campaigns see a dip in organic interest. Use your data to identify the top 10% of your current investors and build new lookalike audiences based on their profiles. It's about aggressive optimization, not panic; the data tells you exactly where to cut the fat.
Disclaimer
Educational only. Not investment, tax, or legal advice. Pre-IPO Hype is investor relations infrastructure for Regulation CF and Regulation A+ raises. We are not a broker-dealer, funding portal, or investment adviser, and we do not offer or sell securities or make investment recommendations. Any securities offering is made only by the issuer, through its own offering documents and, where required, a registered intermediary.